
Daktronics Announces Fourth Quarter and Full Fiscal Year 2026 Results
- Record net sales for fiscal 2026 of
$838.7 million - Record orders for fiscal 2026 of
$860.8 million - Q4 EPS of
$0.17 , adjusted EPS(1) of$0.27 , up 50% from adjusted EPS(1) YoY - Product backlog rose to
$356.2 million at year end with solid pipeline entering fiscal 2027
Fiscal Q4 and full year 2026 financial highlights:
- Q4 sales of
$208.6 million , up 20.9% from the fourth quarter fiscal 2025, and record full year sales of$838.7 million , up 10.9% from full year fiscal 2025 - Q4 operating margin of 6.8% compared to negative operating margin of 1.0% in the year-earlier period, full year operating margin of 7.3%, compared to 4.4% in fiscal 2025
- Q4 earnings per share (“EPS”) of
$0.17 compared to loss per share of$0.19 in the year-earlier period, adjusted EPS(1) of$0.27 compared to$0.18 in the year-earlier period; full-year EPS of$0.92 compared to loss per share of$0.21 in the year-earlier period, full year adjusted EPS of$1.05 (1) compared to$0.84 (1) for fiscal 2025 - Q4 new orders for products and services of
$222.0 million (2), down 7.7% from the exceptionally strong Q4 of fiscal 2025; record full year new orders of$860.8 million (2), up 10.2% compared to full year 2025 - Product backlog of
$356.2 million (2), up 4.3% from prior year end
“During fiscal 2026,
Tracking to Three-Year Plan
As outlined at Daktronics’
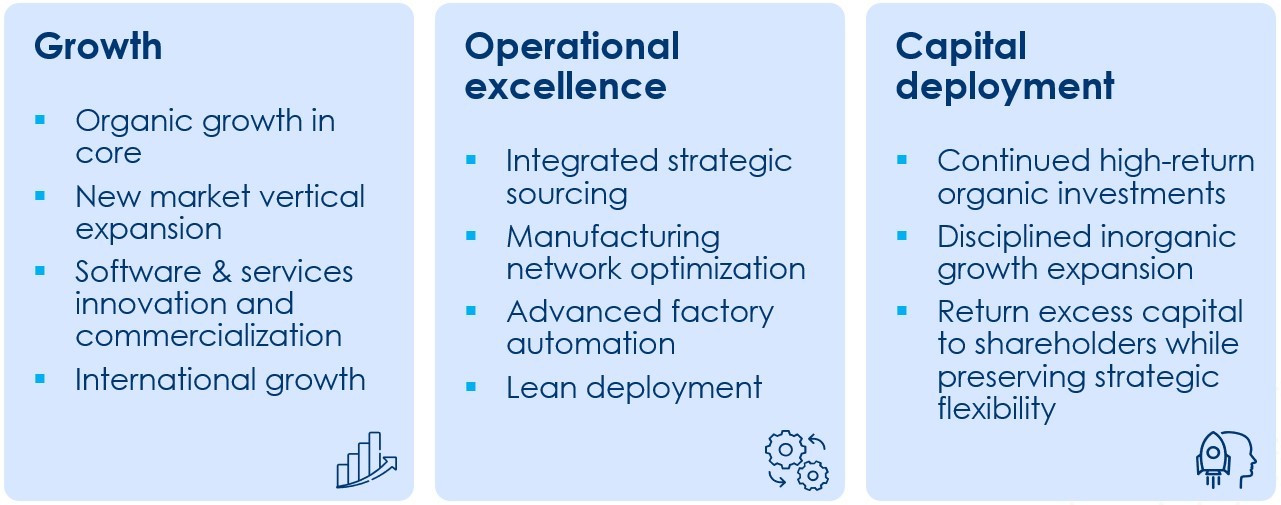
“We enter fiscal 2027 with concrete execution plans in place, balancing our strategic priorities between growth and operational excellence,” said Jayaraman. “Our focus is to enhance our core organic growth capability, optimize our operating model to better serve customers while improving ROIC, and deploying capital in a disciplined manner to support organic growth, pursue targeted M&A, and return capital to shareholders through our share repurchase program. We are well positioned with a
Fourth Quarter and Year-to-Date Results
“Our team delivered an exceptional fiscal 2026, with record net sales, record orders, and a 290 basis point increase in operating margin,” said Daktronics’ Acting Chief Financial Officer
Full year 2026 orders increased 10.2 percent to a record
Net sales for the fourth quarter of fiscal 2026 were up 20.9 percent from the year-earlier period, driven by the Live Events,
Fourth quarter gross profit increased 3.0 percent from a year ago on higher revenue and wider gross profit margin, which increased to 28.0 percent for the fourth quarter of fiscal 2026 compared to 25.0 percent for the fourth quarter of fiscal 2025. A recapture of a prior period warranty provision accounted for 62 basis points of the 28.0 percent gross profit margin. For the full year, gross profit as a percentage of net sales increased to 27.3 percent, including warranty recapture, for fiscal 2026 from 25.8 percent in the prior year. Factors contributing to the margin increase included value-based price increases and operational efficiencies in working capital. The Company is monitoring developments related to tariff refunds, and no amounts have been recognized in the financial statements as of
Operating expenses for the fourth quarter of fiscal 2026 were
Operating expenses during fiscal 2026 also included expenses related to management transition costs, advisory services, and legal expenses associated with the XDC acquisition. By comparison, expenses incurred during fiscal 2025 were primarily related to consultant and advisory costs supporting strategic and digital transformation initiatives and corporate governance matters.
Operating margin was 6.8 percent for the fourth quarter of fiscal 2026 compared to an operating loss of 1.0 percent for the fourth quarter of fiscal 2025. Operating margin was 7.3 percent for fiscal 2026 compared to 4.4 percent for fiscal 2025.
The increase in net interest income for the fourth quarter of fiscal 2026 compared to the same period a year ago is primarily due to a higher average cash level invested in interest-bearing accounts. During the third and fourth quarters of fiscal 2025, interest expense included interest on the convertible note payable, which was settled during fiscal 2025.
The change in fair value of the convertible note was caused by the conversion of the entire convertible note in the third and fourth quarters of fiscal 2025.
The Company’s effective tax rate for fiscal 2026 was 22.2 percent compared to negative 73.0 percent for fiscal 2025. During fiscal 2025, the Company’s effective income tax rate was primarily impacted due to the convertible note fair value adjustment to expense that is not deductible for tax purposes. In fiscal 2026, there were no further impacts of fair value adjustments on the convertible note and our effective tax rate has normalized closer to the
Fourth quarter fiscal 2026 earnings per diluted share were
Balance Sheet and Cash Flow
Cash and cash equivalents totaled
The Company has a
In fiscal 2026,
At the end of fiscal 2026, the Company’s working capital ratio was 2.3 to 1.
Webcast Information
The Company will host a conference call and webcast to discuss its financial results today at
About Daktronics
Daktronics has strong leadership positions in, and is the world’s largest supplier of, large-screen video displays, electronic scoreboards, LED text and graphics displays, and related control systems. The Company excels in the control of display systems, including those that require integration of multiple complex displays showing real-time information, graphics, animation, and video. Daktronics designs, manufactures, markets and services display systems for customers around the world in four domestic business units: Live Events, Commercial, High School Park and Recreation, and Transportation; and one International business unit. For more information, visit the Company’s website at: www.daktronics.com.
Safe Harbor Statement
Cautionary Notice: This press release contains certain statements that by be considered forward-looking statements within the meaning of Section 27A of the Securities Act of 1933, as amended, and Section 21E of the Securities Exchange Act of 1934, as amended, and such statements are subject to the safe harbor created by those sections and the Private Securities Litigation Reform Act of 1995, as amended.
All statements, other than historical facts, included or incorporated in this release could be deemed forward-looking statements, particularly statements that reflect our expectations or beliefs of Daktronics, Inc. (the “Company,” “Daktronics,” “we,” or “us”) concerning future events or our future financial performance. You are cautioned not to place undue reliance on forward-looking statements, which are often characterized by discussions of strategy, plans, or intentions or by the use of words such as “may,” “would,” “could,” “should,” “will,” “expect,” “estimate,” “anticipate,” “believe,” “plan,” “forecast,” “project,” “outlook,” “focus,” “goal,” “target,” “transform,” “expand,” “grow,” “predict,” “potential,” “continue,” or “intend,” the negative or other variants of such terms, or other comparable terminology. The Company cautions that these forward-looking statements are subject to risks and uncertainties that could cause actual results to differ materially from our expectations as a result of various factors, including, but not limited to, changes in economic and market conditions, management of growth, timing and magnitude of future contracts, orders, and capital investment projects, fluctuations in margins, the introduction of new products and technology, the impact of adverse weather conditions, increased regulation, the imposition of tariffs or other trade restrictions, the availability and costs of raw materials, components, and shipping services, geopolitical and governmental actions, expansion into new geographical markets, the Company’s recent leadership transition, transformation initiatives, future strategy, and other risks, trends, and uncertainties described more fully in the Company’s Annual Report on Form 10-K for its 2026 fiscal year (the “Form 10-K”) and in other reports filed with or furnished to the U.S. Securities and Exchange Commission (the "SEC") by the Company. You should carefully consider the trends, risks, and uncertainties described in this press release, the Form 10-K, other reports filed with or furnished to the SEC by the Company, and other press releases and stockholders reports of the Company before making any investment decision with respect to our securities. If any of these trends, risks, or uncertainties continues or occurs, our business, financial condition, or operating results could be materially and adversely affected, the trading prices of our securities could decline, and you could lose part or all of your investment.
Forward-looking statements are made in the context of information available as of the date of this press release and are based on our current expectations, forecasts, estimates, and assumptions. The Company disclaims any obligation to update or revise any forward-looking statements to reflect actual results or circumstances or events occurring after this release affecting the forward-looking statements except as may be required by applicable law. All forward-looking statements attributable to us or persons acting on our behalf are expressly qualified in their entirety by this cautionary statement.
For more information contact:
INVESTOR RELATIONS:
Howard Atkins, Acting Chief Financial Officer
Tel (605) 692-0200
Investor@daktronics.com
Alliance Advisors IR
Carolyn Capaccio / Jody Burfening
DAKTIRTeam@allianceadvisors.com
MEDIA RELATIONS
media@daktronics.com
Consolidated Statements of Operations (in thousands, except per share amounts) (unaudited) |
|||||||||||||||
| Three Months Ended | Year Ended | ||||||||||||||
| Net sales | $ | 208,610 | $ | 172,551 | $ | 838,706 | $ | 756,477 | |||||||
| Cost of sales | 150,130 | 129,406 | 609,700 | 560,990 | |||||||||||
| Gross profit | 58,480 | 43,145 | 229,006 | 195,487 | |||||||||||
| Operating expenses: | |||||||||||||||
| Selling | 16,590 | 15,200 | 64,815 | 60,011 | |||||||||||
| General and administrative | 15,984 | 19,727 | 59,885 | 63,498 | |||||||||||
| Product design and development | 11,815 | 9,958 | 43,458 | 38,860 | |||||||||||
| 44,389 | 44,885 | 168,158 | 162,369 | ||||||||||||
| Operating income (loss) | 14,091 | (1,740 | ) | 60,848 | 33,118 | ||||||||||
| Nonoperating income (expense): | |||||||||||||||
| Interest income (expense), net | 1,107 | 637 | 3,630 | 1,347 | |||||||||||
| Change in fair value of convertible note | — | 2,848 | — | (22,521 | ) | ||||||||||
| Other expense, net | (4,461 | ) | (15,183 | ) | (6,144 | ) | (17,795 | ) | |||||||
| Income (loss) before income taxes | 10,737 | (13,438 | ) | 58,334 | (5,851 | ) | |||||||||
| Income tax expense (benefit) | 2,322 | (4,013 | ) | 12,958 | 4,270 | ||||||||||
| Net income (loss) | $ | 8,415 | $ | (9,425 | ) | $ | 45,376 | $ | (10,121 | ) | |||||
| Weighted average shares outstanding: | |||||||||||||||
| Basic | 48,258 | 49,516 | 48,564 | 47,587 | |||||||||||
| Diluted | 49,032 | 49,516 | 49,382 | 47,587 | |||||||||||
| Earnings (loss) per share: | |||||||||||||||
| Basic | $ | 0.17 | $ | (0.19 | ) | $ | 0.93 | $ | (0.21 | ) | |||||
| Diluted | $ | 0.17 | $ | (0.19 | ) | $ | 0.92 | $ | (0.21 | ) | |||||
Consolidated Balance Sheets (in thousands) (unaudited) |
|||||
2025 |
|||||
| ASSETS | |||||
| CURRENT ASSETS: | |||||
| Cash and cash equivalents | $ | 131,639 | $ | 127,507 | |
| Accounts receivable, net | 118,590 | 92,762 | |||
| Inventories | 110,471 | 105,839 | |||
| Contract assets | 66,552 | 41,169 | |||
| Current maturities of long-term receivables | 3,405 | 2,437 | |||
| Prepaid expenses and other current assets | 11,278 | 8,520 | |||
| Income tax receivables | 6,047 | 3,217 | |||
| Total current assets | 447,982 | 381,451 | |||
| Property and equipment, net | 64,263 | 73,884 | |||
| Long-term receivables, less current maturities | 1,125 | 1,030 | |||
| 3,685 | 3,188 | ||||
| Intangibles, net | 3,263 | 568 | |||
| Debt issuance costs, net | — | 1,289 | |||
| Right of use, investment in affiliates, and other assets | 11,828 | 9,378 | |||
| Deferred income taxes | 22,266 | 32,104 | |||
| TOTAL ASSETS | $ | 554,412 | $ | 502,892 | |
Consolidated Balance Sheets (continued) (in thousands) (unaudited) |
|||||||
2025 |
|||||||
| LIABILITIES AND STOCKHOLDERS’ EQUITY | |||||||
| CURRENT LIABILITIES: | |||||||
| Current portion of long-term debt | $ | 1,150 | $ | 1,500 | |||
| Accounts payable | 68,617 | 46,669 | |||||
| Contract liabilities | 65,310 | 69,050 | |||||
| Accrued expenses | 44,858 | 41,705 | |||||
| Warranty obligations | 12,398 | 12,706 | |||||
| Income taxes payable | 1,375 | 375 | |||||
| Total current liabilities | 193,708 | 172,005 | |||||
| Long-term warranty obligations | 24,362 | 23,124 | |||||
| Long-term contract liabilities | 20,655 | 18,421 | |||||
| Other long-term obligations | 5,289 | 6,839 | |||||
| Long-term debt, net | 9,629 | 10,487 | |||||
| Deferred income taxes | 22 | 85 | |||||
| Total long-term liabilities | 59,957 | 58,956 | |||||
| STOCKHOLDERS’ EQUITY: | |||||||
| Preferred Shares, outstanding |
— | — | |||||
| Common stock, shares issued as of |
— | — | |||||
| Additional paid-in capital | 196,837 | 189,940 | |||||
| Retained earnings | 173,286 | 127,910 | |||||
| (65,324 | ) | (39,759 | ) | ||||
| Accumulated other comprehensive loss | (4,052 | ) | (6,160 | ) | |||
| TOTAL STOCKHOLDERS’ EQUITY | 300,747 | 271,931 | |||||
| TOTAL LIABILITIES AND STOCKHOLDERS’ EQUITY | $ | 554,412 | $ | 502,892 | |||
Consolidated Statements of Cash Flows (in thousands) (unaudited) |
|||||||
| Year Ended | |||||||
2025 |
|||||||
| CASH FLOWS FROM OPERATING ACTIVITIES: | |||||||
| Net income (loss) | $ | 45,376 | $ | (10,121 | ) | ||
| Adjustments to reconcile net income to net cash provided by operating activities: | |||||||
| Depreciation and amortization | 19,339 | 19,547 | |||||
| Gain on sale of property, equipment and other assets | (209 | ) | (156 | ) | |||
| Share-based compensation | 4,905 | 2,944 | |||||
| Equity in loss of affiliates | 2,008 | 3,053 | |||||
| Allowance for credit losses on affiliate loan | 3,205 | 15,480 | |||||
| Provision (recovery) for doubtful accounts, net | 627 | (644 | ) | ||||
| Deferred income taxes, net | 9,938 | (6,300 | ) | ||||
| Change in fair value of convertible note | — | 22,521 | |||||
| Change in operating assets and liabilities | (35,972 | ) | 51,389 | ||||
| Net cash provided by operating activities | 49,217 | 97,713 | |||||
| CASH FLOWS FROM INVESTING ACTIVITIES: | |||||||
| Purchases of property and equipment | (14,917 | ) | (19,494 | ) | |||
| Proceeds from sales of property, equipment and other assets | 615 | 277 | |||||
| Acquisition, net of cash acquired | 44 | — | |||||
| Loans to equity investees | (5,383 | ) | (4,565 | ) | |||
| Net cash used in investing activities | (19,641 | ) | (23,782 | ) | |||
| CASH FLOWS FROM FINANCING ACTIVITIES: | |||||||
| Borrowings on notes payable | 1,400 | — | |||||
| Payments on notes payable | (2,883 | ) | (2,108 | ) | |||
| Principal payments on long-term obligations | (104 | ) | (414 | ) | |||
| Payments for common shares repurchased | (25,565 | ) | (29,474 | ) | |||
| Proceeds from exercise of stock options | 1,796 | 5,153 | |||||
| Tax payments related to RSU issuances | (882 | ) | (606 | ) | |||
| Net cash used in financing activities | (26,238 | ) | (27,449 | ) | |||
| EFFECT OF EXCHANGE RATE CHANGES ON CASH | 794 | (653 | ) | ||||
| NET INCREASE IN CASH, CASH EQUIVALENTS AND RESTRICTED CASH | 4,132 | 45,829 | |||||
| CASH, CASH EQUIVALENTS AND RESTRICTED CASH: | |||||||
| Beginning of period | 127,507 | 81,678 | |||||
| End of period | $ | 131,639 | $ | 127,507 | |||
(in thousands) (unaudited) |
|||||||||||||||||||||||||
| Three Months Ended | Twelve Months Ended | ||||||||||||||||||||||||
2026 |
2025 |
Dollar Change |
Percent Change |
2026 |
2025 |
Dollar Change |
Percent Change |
||||||||||||||||||
| Commercial | $ | 40,347 | $ | 40,589 | $ | (242 | ) | (0.6) | % | $ | 180,772 | $ | 156,203 | $ | 24,569 | 15.7 | % | ||||||||
| Live Events | 84,861 | 59,597 | 25,264 | 42.4 | 321,053 | 291,484 | 29,569 | 10.1 | |||||||||||||||||
| High School Park and Recreation |
46,287 | 40,477 | 5,810 | 14.4 | 183,250 | 165,921 | 17,329 | 10.4 | |||||||||||||||||
| Transportation | 23,578 | 18,304 | 5,274 | 28.8 | 76,700 | 81,061 | (4,361 | ) | (5.4 | ) | |||||||||||||||
| International | 13,537 | 13,584 | (47 | ) | (0.3 | ) | 76,931 | 61,808 | 15,123 | 24.5 | |||||||||||||||
| $ | 208,610 | $ | 172,551 | $ | 36,059 | 20.9 | % | $ | 838,706 | $ | 756,477 | $ | 82,229 | 10.9 | % | ||||||||||
| Orders: | |||||||||||||||||||||||||
| Commercial | $ | 44,131 | $ | 48,930 | $ | (4,799 | ) | (9.8 | )% | $ | 172,089 | $ | 176,583 | $ | (4,494 | ) | (2.5) | % | |||||||
| Live Events | 81,195 | 84,225 | (3,030 | ) | (3.6 | ) | 336,012 | 283,780 | 52,232 | 18.4 | |||||||||||||||
| High School Park and Recreation |
50,136 | 59,263 | (9,127 | ) | (15.4 | ) | 188,245 | 176,097 | 12,148 | 6.9 | |||||||||||||||
| Transportation | 21,692 | 23,496 | (1,804 | ) | (7.7 | ) | 89,467 | 72,315 | 17,152 | 23.7 | |||||||||||||||
| International | 24,892 | 24,769 | 123 | 0.5 | 75,022 | 72,572 | 2,450 | 3.4 | |||||||||||||||||
| $ | 222,046 | $ | 240,683 | $ | (18,637 | ) | (7.7) | % | $ | 860,835 | $ | 781,347 | $ | 79,488 | 10.2 | % | |||||||||
| Reconciliation of Free Cash Flow* (in thousands) (unaudited) |
|||||||
| Twelve Months Ended | |||||||
2026 |
2025 |
||||||
| Net cash provided by operating activities | $ | 49,217 | $ | 97,713 | |||
| Purchases of property and equipment | (14,917 | ) | (19,494 | ) | |||
| Proceeds from sales of property and equipment | 615 | 277 | |||||
| Free cash flow | $ | 34,915 | $ | 78,496 | |||
| * | The table above reconciles free cash flow to the most directly comparable GAAP financial measure. In evaluating its business, |
| Reconciliation of Adjusted Operating Income* (in thousands) (unaudited) |
||||||||||||
| Three Months Ended | Twelve Months Ended | |||||||||||
2026 |
2025 |
2026 |
2025 |
|||||||||
| Operating income (loss) (GAAP measure) | $ | 14,091 | $ | (1,740 | ) | $ | 60,848 | $ | 33,118 | |||
| Management transition expenses | 100 | 2,614 | 2,145 | 2,614 | ||||||||
| XDC acquisition, advisory, and legal costs | 126 | — | 575 | — | ||||||||
| Consultant related expenses associated with business transformation initiatives | 1,062 | 1,031 | 1,062 | 7,085 | ||||||||
| Corporate governance expenses | — | 3,881 | — | 6,825 | ||||||||
| Adjusted operating income (non-GAAP measure) | $ | 15,379 | $ | 5,786 | $ | 64,630 | $ | 49,642 | ||||
| * | In evaluating its business, |
| Reconciliation of Adjusted Net Income and Adjusted Earnings per Share* (in thousands, except per share data) (unaudited) |
|||||||||||||
| Three Months Ended | Twelve Months Ended | ||||||||||||
2025 |
2025 |
||||||||||||
| Net income (loss) (GAAP measure) | $ | 8,415 | $ | (9,425 | ) | $ | 45,376 | $ | (10,121 | ) | |||
| Management transition, net of taxes | 74 | 1,934 | 1,587 | 1,934 | |||||||||
| XDC acquisition, advisory, and legal costs | 93 | — | 426 | — | |||||||||
| Consultant related expenses associated with business transformation initiatives, net of taxes |
786 | 763 | 786 | 5,243 | |||||||||
| Allowance for credit losses on affiliate loan | 3,750 | 15,480 | 3,750 | 15,480 | |||||||||
| Corporate governance expenses, net of taxes | — | 2,872 | — | 5,050 | |||||||||
| Change in fair value of convertible note | — | (2,848 | ) | — | 22,521 | ||||||||
| Adjusted net income (non-GAAP measure) | $ | 13,118 | $ | 8,776 | $ | 51,925 | $ | 40,107 | |||||
| Diluted weighted-average number of common shares outstanding | 49,032 | 49,516 | 49,382 | 47,587 | |||||||||
| Diluted earnings (loss) per share (GAAP measure) | $ | 0.17 | $ | (0.19 | ) | $ | 0.92 | $ | (0.21 | ) | |||
| Adjusted diluted earnings per share (non-GAAP measure) | $ | 0.27 | $ | 0.18 | $ | 1.05 | $ | 0.84 | |||||
| * | Adjusted net income using 26% tax rate. The table above reconciles adjusted net income and adjusted EPS to the most directly comparable GAAP financial measure. In evaluating its business, |
| Reconciliation of Long-term Debt (in thousands) (unaudited) |
|||||||
| Long-term debt consists of the following: |
|||||||
2026 |
2025 |
||||||
| Mortgage | 10,925 | 12,375 | |||||
| Long-term debt, gross | 10,925 | 12,375 | |||||
| Debt issuance costs, net | (146 | ) | (388 | ) | |||
| Current portion | (1,150 | ) | (1,500 | ) | |||
| Long-term debt, net | $ | 9,629 | $ | 10,487 | |||
A photo accompanying this announcement is available at https://www.globenewswire.com/NewsRoom/AttachmentNg/613efaa5-5af4-4fbe-9e09-e723b1ce9d59.

![]()
Daktronics, Inc.
Daktronics, Inc.
Source: Daktronics, Inc.